Free Access
Fig. 2
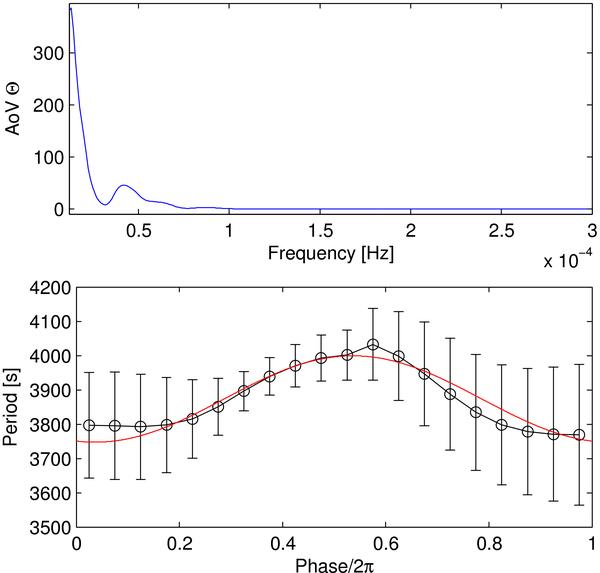
(upper) AoV periodogram for a QPO period indicating additional periodicity at 24 008 s. (bottom) The QPO period curve folded with a period of 24 008 s. Although the presence of that additional period would be interesting, its formal significance is very low.
This figure is made of several images, please see below:
Current usage metrics show cumulative count of Article Views (full-text article views including HTML views, PDF and ePub downloads, according to the available data) and Abstracts Views on Vision4Press platform.
Data correspond to usage on the plateform after 2015. The current usage metrics is available 48-96 hours after online publication and is updated daily on week days.
Initial download of the metrics may take a while.