Free Access
Fig. 1
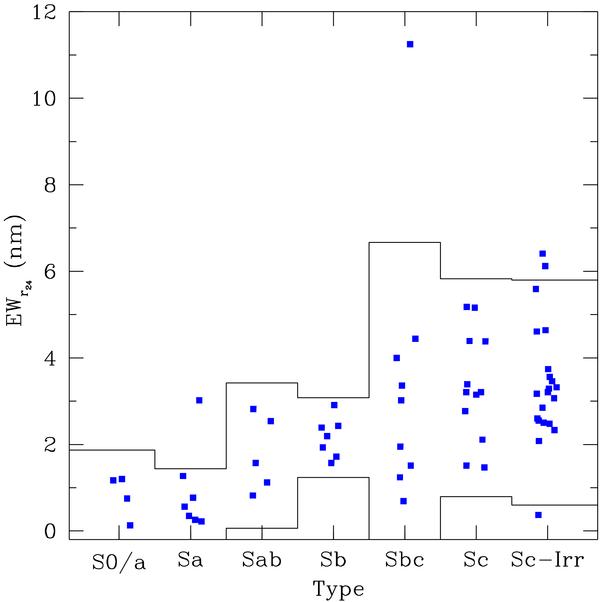
Global EW vs. morphological type for the full field comparison sample. Solid lines show the 2σ limits of the field population. Typical errors in EW are 10–15% for high EW (>2 nm) and 25–35% for low EW (<2 nm) galaxies (Shane & James 2002).
Current usage metrics show cumulative count of Article Views (full-text article views including HTML views, PDF and ePub downloads, according to the available data) and Abstracts Views on Vision4Press platform.
Data correspond to usage on the plateform after 2015. The current usage metrics is available 48-96 hours after online publication and is updated daily on week days.
Initial download of the metrics may take a while.