Fig. 4
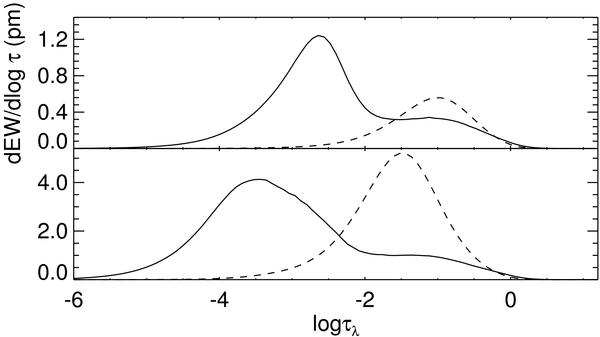
Contribution functions of the EW at disc-centre, defined in a way that their integral over log τλ gives the EW (Magain 1986), for the Cu i 324.7 nm line and the model d3t63g40mm20n01 for two different values of Cu abundance. In the upper panel A(Cu) = 0.2, in the lower panel A(Cu) = 1.7. The solid lines refer to the 3D model, the dashed lines to the corresponding 1DLHD model.
Current usage metrics show cumulative count of Article Views (full-text article views including HTML views, PDF and ePub downloads, according to the available data) and Abstracts Views on Vision4Press platform.
Data correspond to usage on the plateform after 2015. The current usage metrics is available 48-96 hours after online publication and is updated daily on week days.
Initial download of the metrics may take a while.