Fig. 3
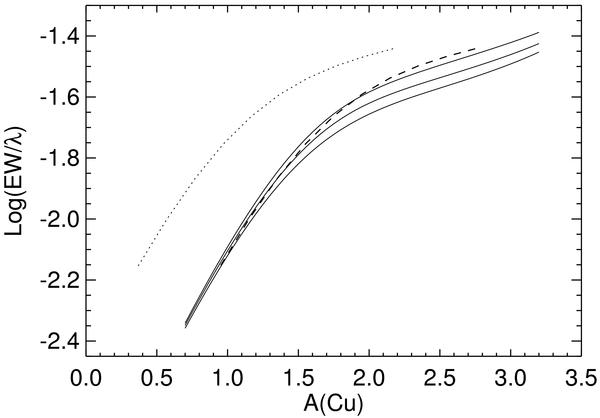
Curves of growth (COG) for the Cu i 327.3 nm transition. The dotted line to the left is the COG for the 3D model d3t63g40m20n01, the three solid lines to the right are those for the corresponding 1DLHD model for three values of the microturbulent velocity: 0.5, 1.0 and 1.5 kms-1, bottom to top. The dashed line is the 3D COG shifted arbitrarily by +0.58 dex along the x-axis. This highlights that the shape of the 3D COG differs from that of the corresponding 1D COGs and therefore the 3D correction depends on the EW of the transition.
Current usage metrics show cumulative count of Article Views (full-text article views including HTML views, PDF and ePub downloads, according to the available data) and Abstracts Views on Vision4Press platform.
Data correspond to usage on the plateform after 2015. The current usage metrics is available 48-96 hours after online publication and is updated daily on week days.
Initial download of the metrics may take a while.