Fig. 2
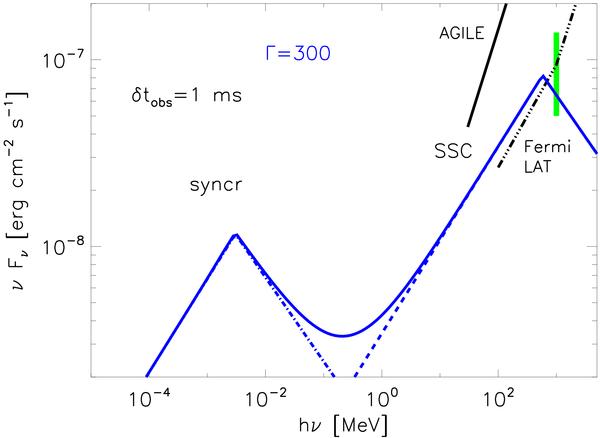
Synchrotron (blue dot-dashed line) and SSC (blue dashed line) emission spectra from delayed IS for a burst with parameters L52 = 10-3, δtobs = 1 ms, ϵe = 0.5, ϵB = 0.01, p = 2.9, z = 0.1, Γ = 300. The blue solid line is the sum of the synchrotron and SSC contributions. The black solid and dot-dot-dot-dashed lines are the AGILE and Fermi/LAT sensitivity for an integration time of 10 s, respectively (see Galli & Piro 2007). For this choice of parameters, one has a synchrotron peak around 10 keV and an SSC peak around ~1 GeV. The green solid vertical line indicates the flux level at 1 GeV, as reported by Abdo et al. (2010) for interval c. See the electronic version of this paper for colors.
Current usage metrics show cumulative count of Article Views (full-text article views including HTML views, PDF and ePub downloads, according to the available data) and Abstracts Views on Vision4Press platform.
Data correspond to usage on the plateform after 2015. The current usage metrics is available 48-96 hours after online publication and is updated daily on week days.
Initial download of the metrics may take a while.