Fig. 2
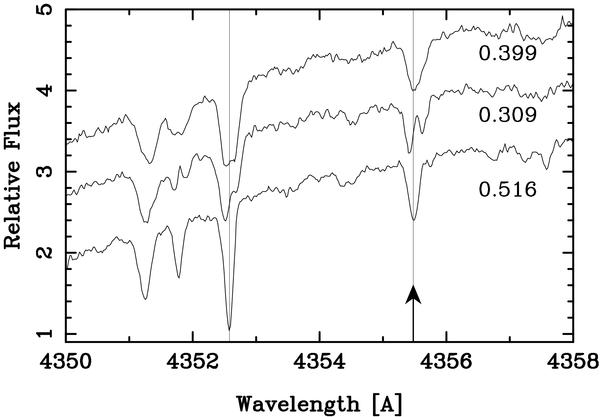
Kr ii 4355.48 is indicated by the arrow. Spectra for three indicated phases have been displaced vertically for display purposes. We interpret the doubling of the Kr ii at phase 0.309 as due to approaching and receeding spots. The length of the arrow, from base to tip is 0.04 of the continuum. The plot is in the wing of Hγ. A vertical line is drawn through Fe iii λ4352.58. The O ii and Fe ii lines λλ4351.23 and 4351.77 appear shortward of this feature.
Current usage metrics show cumulative count of Article Views (full-text article views including HTML views, PDF and ePub downloads, according to the available data) and Abstracts Views on Vision4Press platform.
Data correspond to usage on the plateform after 2015. The current usage metrics is available 48-96 hours after online publication and is updated daily on week days.
Initial download of the metrics may take a while.