Fig. 1
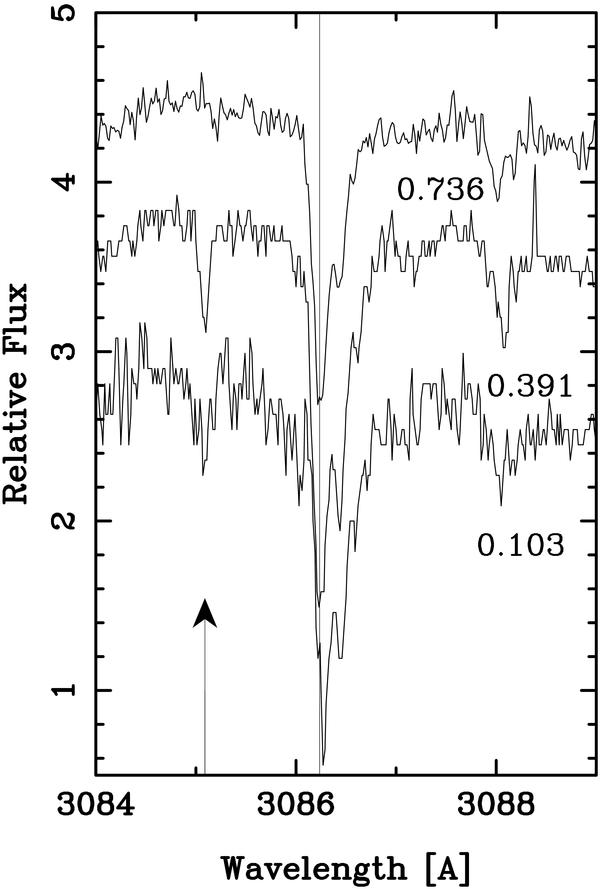
Variations in a Cen of Ce iii in λ3085.10 at three indicated phases. The rest wavelength is indicated by the arrow. Spectra have been displaced vertically for display purposes. The length of the arrow, from base to tip is 0.12 of the continuum. The strongest feature is a blend of Si iii, λλ3086.24, 3086.44, and 3086.67. The absorption feature near λ3088 is Fe ii 3087.97.
Current usage metrics show cumulative count of Article Views (full-text article views including HTML views, PDF and ePub downloads, according to the available data) and Abstracts Views on Vision4Press platform.
Data correspond to usage on the plateform after 2015. The current usage metrics is available 48-96 hours after online publication and is updated daily on week days.
Initial download of the metrics may take a while.