Fig. 7
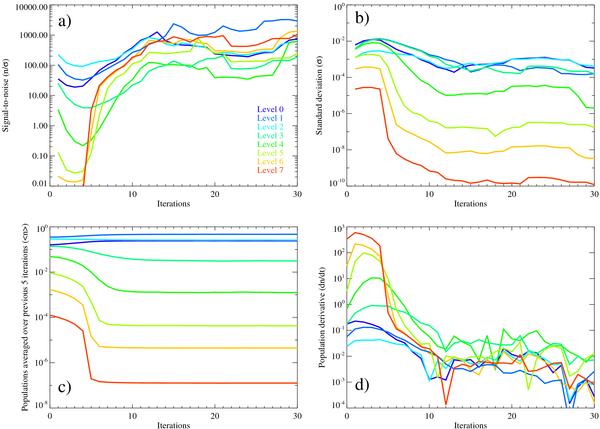
This figure shows the convergence history of a single grid point in a LIME run. Different colors refers to the quantum states 0–7. Panel a) shows the signal-to-noise ratio of the current iteration. Panel b) shows the standard deviation, calculated from the previous five iterations. Panel c) shows the average population over the previous five iterations and panel d) shows the derivative of the populations.
Current usage metrics show cumulative count of Article Views (full-text article views including HTML views, PDF and ePub downloads, according to the available data) and Abstracts Views on Vision4Press platform.
Data correspond to usage on the plateform after 2015. The current usage metrics is available 48-96 hours after online publication and is updated daily on week days.
Initial download of the metrics may take a while.