Fig. 5
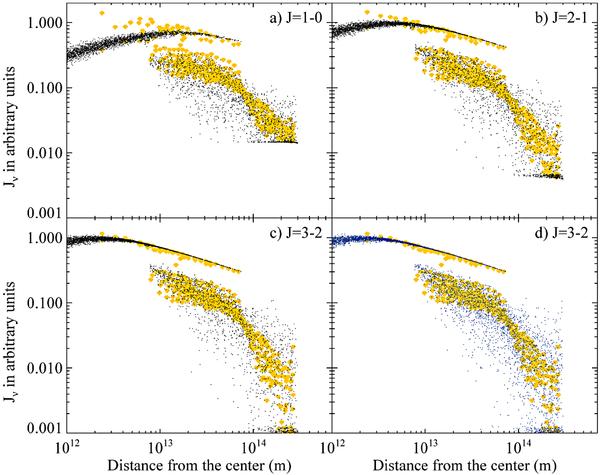
A comparison of Jν between LIME and RATRAN. The small black dots are the values from the LIME code and the yellow dots are the cell values from RATRAN. The blue dots in panel d) are also from a LIME model, but where all the grid points have been distributed randomly over the model domain (with no density weighting).
Current usage metrics show cumulative count of Article Views (full-text article views including HTML views, PDF and ePub downloads, according to the available data) and Abstracts Views on Vision4Press platform.
Data correspond to usage on the plateform after 2015. The current usage metrics is available 48-96 hours after online publication and is updated daily on week days.
Initial download of the metrics may take a while.