Fig. 3
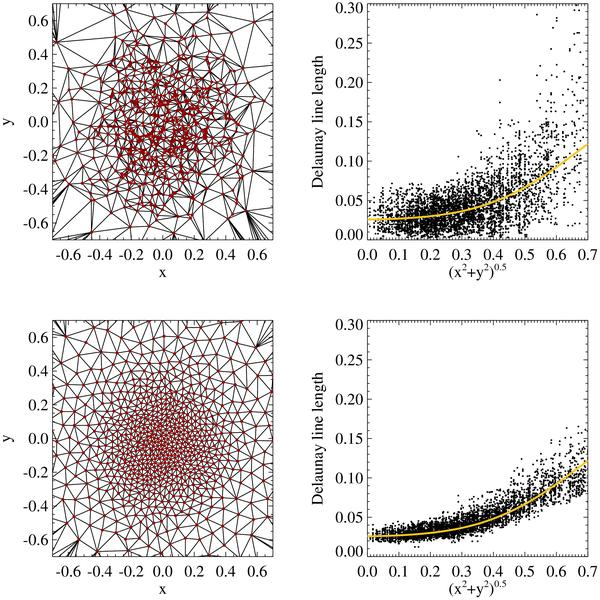
An unsmoothed (top) and smoothed (bottom) Delaunay grid based on a Gaussian density distribution. The right hand column shows the neighbor point separations as function of radius. The yellow lines are aids to the eye. They show a Gaussian distribution that describes the density distribution.
Current usage metrics show cumulative count of Article Views (full-text article views including HTML views, PDF and ePub downloads, according to the available data) and Abstracts Views on Vision4Press platform.
Data correspond to usage on the plateform after 2015. The current usage metrics is available 48-96 hours after online publication and is updated daily on week days.
Initial download of the metrics may take a while.