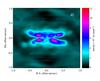
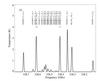
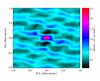
Fig. 12
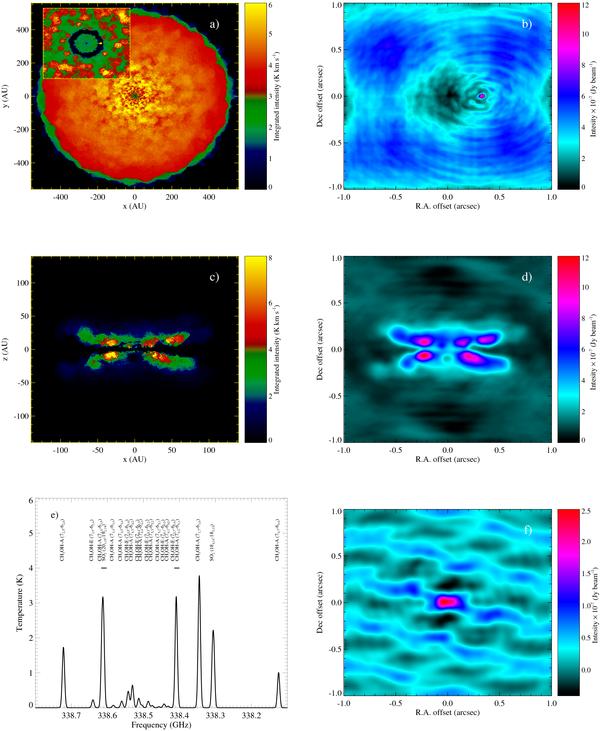
The LIME output (left column) and corresponding ALMA simulations (right column) of the disk model example presented in Sect. 4. Panels a) and b) show the disk face-on in HCO+J = 7–6, panels c) and d) show the disk edge-on in H2O J = 313–220, and panel e) shows the average A- and E-CH3OH spectrum as well as a couple of SO2 lines which falls in this window. Panel f) is an ALMA simulation similar to the one in panel d), but for only 6 antennas. The ALMA simulations shown in panel b) and d) corresponds to 2 h tracks with the full array. The noise level in both simulations is about 2.5 × 10⁻⁷ Jy beam-1. The simulation in panel f) is for a much more compact ALMA configuration with a noise level of 0.2 × 10⁻⁷ Jy beam-1.
Current usage metrics show cumulative count of Article Views (full-text article views including HTML views, PDF and ePub downloads, according to the available data) and Abstracts Views on Vision4Press platform.
Data correspond to usage on the plateform after 2015. The current usage metrics is available 48-96 hours after online publication and is updated daily on week days.
Initial download of the metrics may take a while.