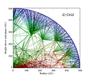
Fig. 11
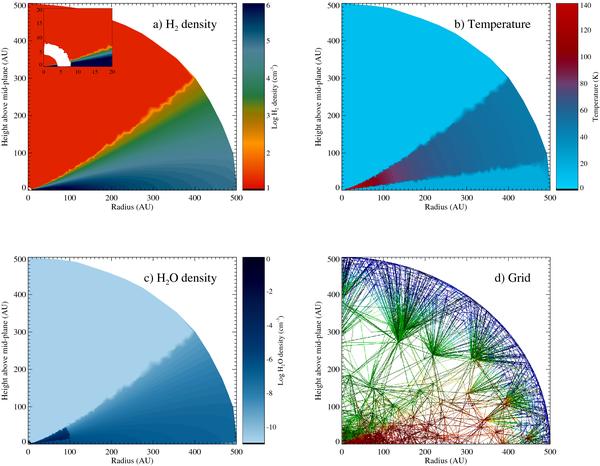
Visualization of the upper right quadrant of the disk model described in Sect. 4. Panel a) shows the H2 density with the insert showing the gap (shell) carved out around 5 AU. Panel b) shows the temperature and c) shows the molecular density which has a discontinuity around 90 K where water freezes out. The last panel, d), shows a cut through the grid, color coded according to the density.
Current usage metrics show cumulative count of Article Views (full-text article views including HTML views, PDF and ePub downloads, according to the available data) and Abstracts Views on Vision4Press platform.
Data correspond to usage on the plateform after 2015. The current usage metrics is available 48-96 hours after online publication and is updated daily on week days.
Initial download of the metrics may take a while.