Fig. 5
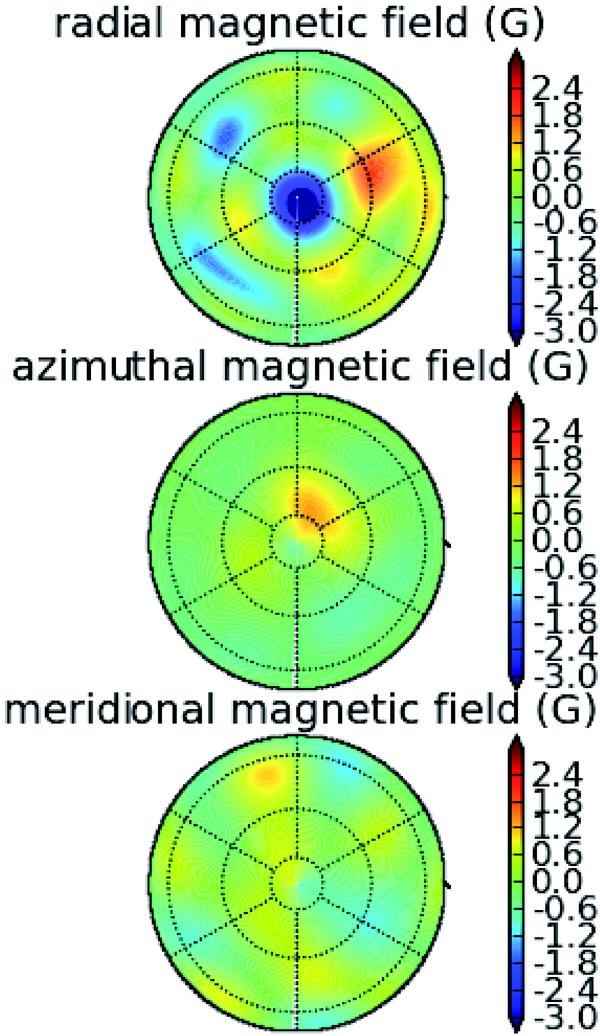
Vectorial magnetic map of Vega for 2008 July, in polar projection. The 3 charts illustrate the field projection onto one axis of the spherical coordinate frame with the radial, azimuthal, and meridional field components. The magnetic field strength is expressed in Gauss. The phase origin is set at the bottom of each chart and rotational phases are increasing in the clockwise direction.
Current usage metrics show cumulative count of Article Views (full-text article views including HTML views, PDF and ePub downloads, according to the available data) and Abstracts Views on Vision4Press platform.
Data correspond to usage on the plateform after 2015. The current usage metrics is available 48-96 hours after online publication and is updated daily on week days.
Initial download of the metrics may take a while.