Fig. 4
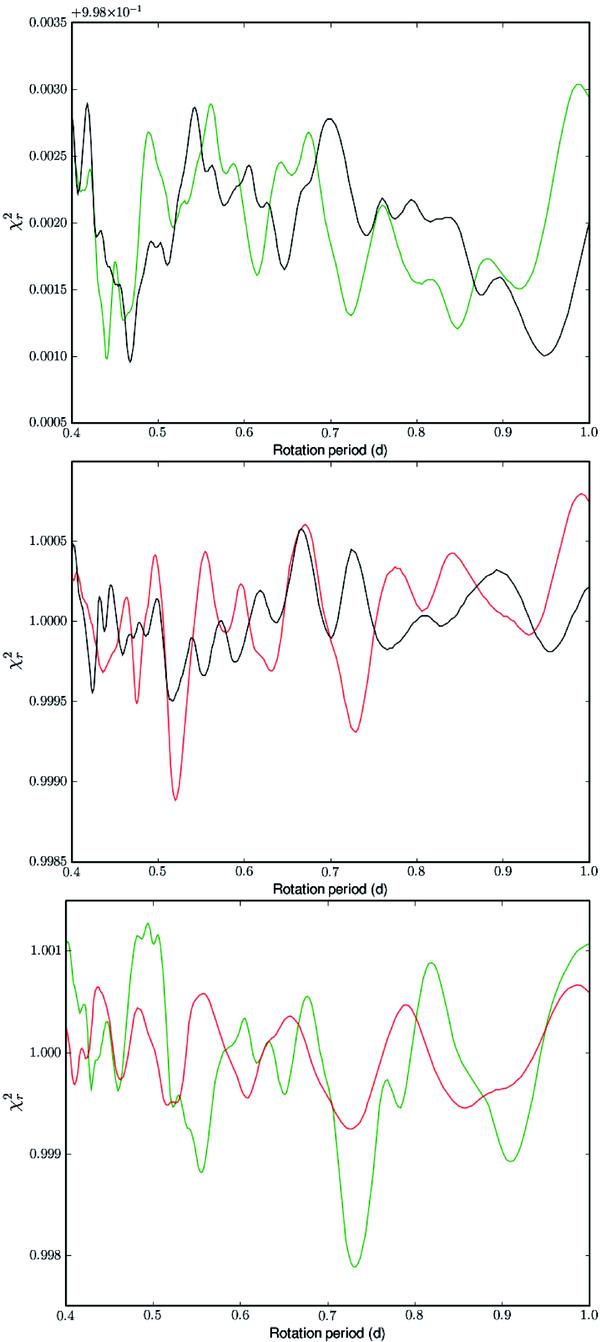
Top panel: same as Fig. 3, but this time the periodogram for July 2008 (green line) is compared to a shuffled data set, in which each individual Stokes V profile has been randomly associated to the Julian date of another profile of the same time-series (black line). Middle panel: same as the upper part of the plot, but with observations of September 2009 (red line) and their shuffled counterpart (black line). Bottom panel: same as Fig. 3, but using two sets of fake Stokes V profiles computed by ZDI using our time-sampling of July 2008 and September 2009 (green and red lines, respectively).
Current usage metrics show cumulative count of Article Views (full-text article views including HTML views, PDF and ePub downloads, according to the available data) and Abstracts Views on Vision4Press platform.
Data correspond to usage on the plateform after 2015. The current usage metrics is available 48-96 hours after online publication and is updated daily on week days.
Initial download of the metrics may take a while.