Fig. 3
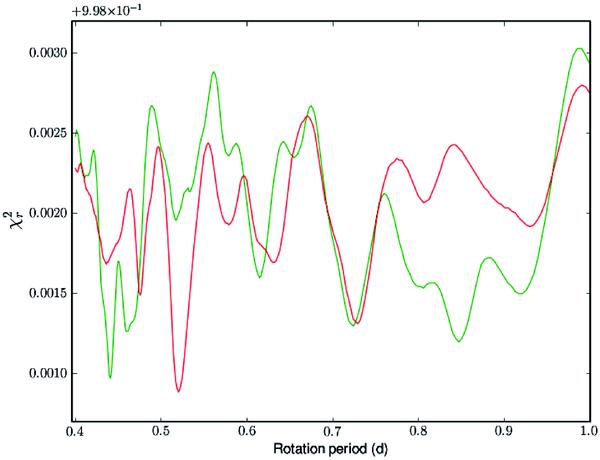
Periodograms obtained from the NARVAL data set of July 2008 (green line) and from the ESPaDOnS observations of September 2009 (red curve). The numerical value 9.98 × 10⁻¹ indicated on top left must be added to the values of the vertical axis.
Current usage metrics show cumulative count of Article Views (full-text article views including HTML views, PDF and ePub downloads, according to the available data) and Abstracts Views on Vision4Press platform.
Data correspond to usage on the plateform after 2015. The current usage metrics is available 48-96 hours after online publication and is updated daily on week days.
Initial download of the metrics may take a while.