Fig. 1
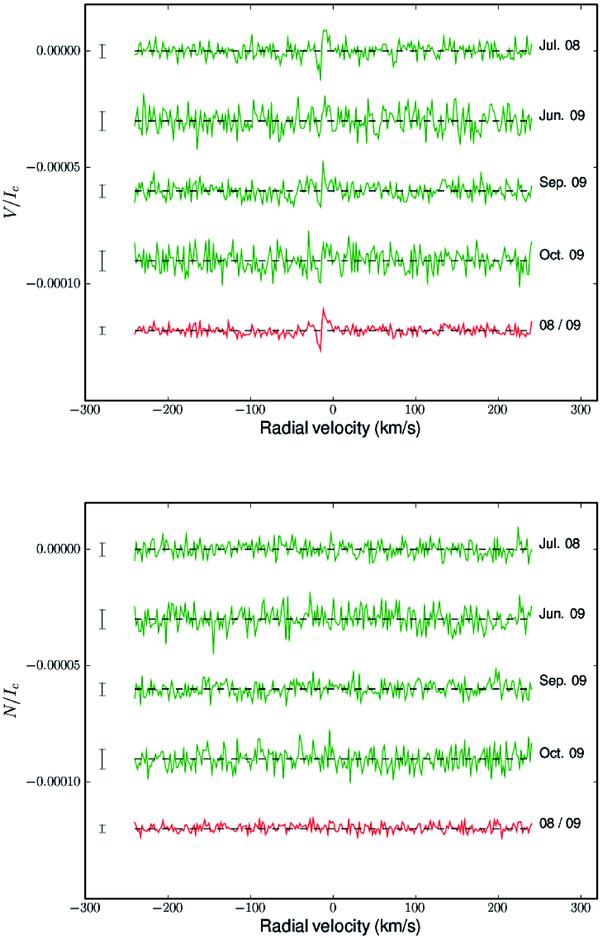
Top panel: averaged Stokes V LSD profiles of Vega for the various observing runs (green lines). The red line is obtained by averaging all 799 Stokes V profiles at our disposal. Note that successive profiles are shifted vertically for better clarity. The error bar corresponding to each profile is plotted at left. Bottom panel: same as upper part of the plot, for the “null” control profiles.
Current usage metrics show cumulative count of Article Views (full-text article views including HTML views, PDF and ePub downloads, according to the available data) and Abstracts Views on Vision4Press platform.
Data correspond to usage on the plateform after 2015. The current usage metrics is available 48-96 hours after online publication and is updated daily on week days.
Initial download of the metrics may take a while.