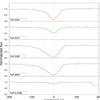
Fig. 3
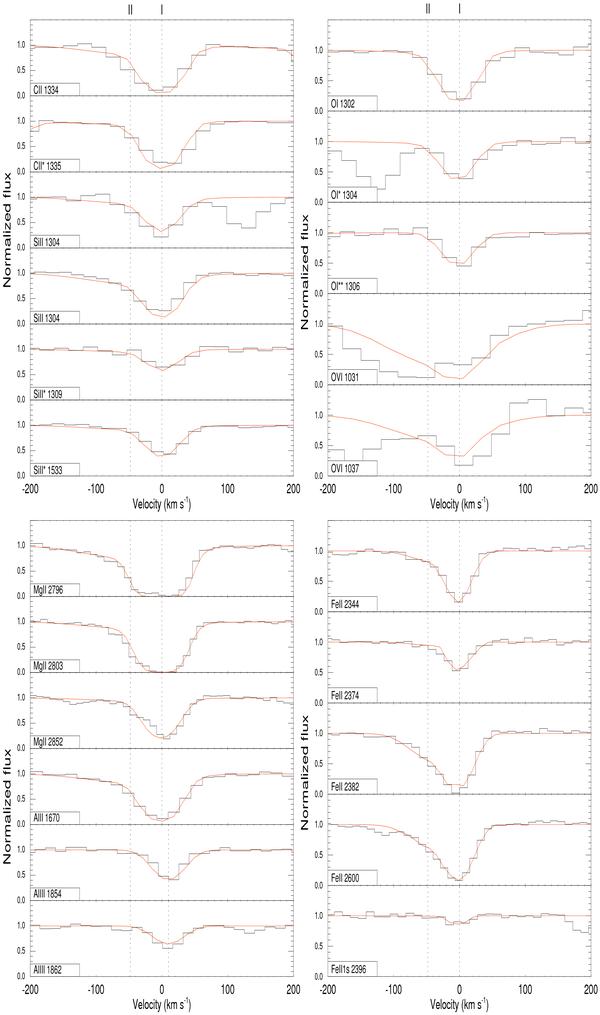
The C ii and Si ii (top left panel), O i and O vi (top right panel), Mg i, Mg ii, Al ii and Al iii (bottom left panel), Fe ii (bottom right panel) absorption features. Solid lines represent the two Voigt components, best-fit model. Vertical lines identify the component velocities. The zero point has been arbitrarily placed at the redshift of the red component (z = 2.1071). The O vi features are blended at blue wavelengths. Component I of Al iii has been slightly shifted for an adequately fit.
Current usage metrics show cumulative count of Article Views (full-text article views including HTML views, PDF and ePub downloads, according to the available data) and Abstracts Views on Vision4Press platform.
Data correspond to usage on the plateform after 2015. The current usage metrics is available 48-96 hours after online publication and is updated daily on week days.
Initial download of the metrics may take a while.