Fig. 4
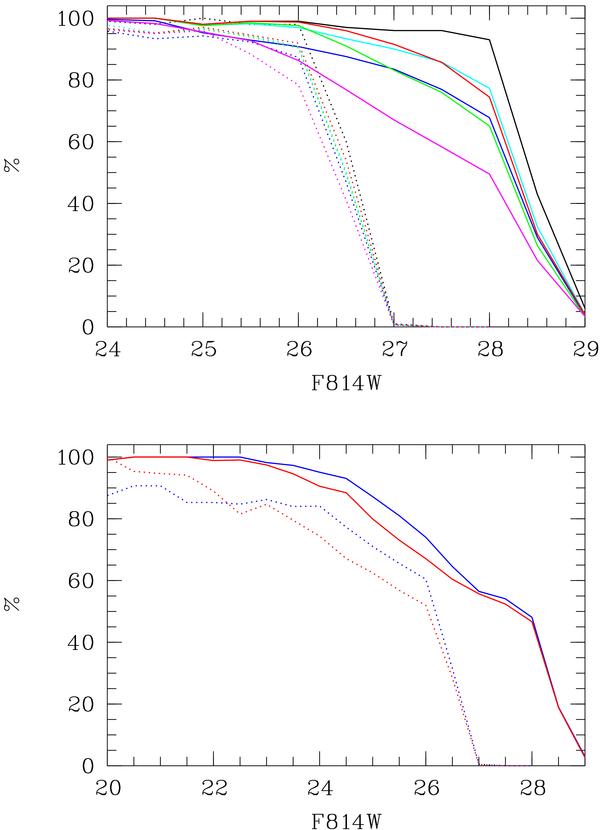
Detection levels for point sources in the LCDCS 0541 fields. Continuous lines correspond to the deep parts of the HST ACS F814W images and dotted lines to the shallow parts. Top figure: blue: B band, cyan: V band, green: R band, red: I band, black: F814W band, magenta: z′ band. Bottom figure: blue: Irac 1 band, red: Irac 2 band. Each curve is given as a function of the F814W magnitude.
Current usage metrics show cumulative count of Article Views (full-text article views including HTML views, PDF and ePub downloads, according to the available data) and Abstracts Views on Vision4Press platform.
Data correspond to usage on the plateform after 2015. The current usage metrics is available 48-96 hours after online publication and is updated daily on week days.
Initial download of the metrics may take a while.