Fig. 23
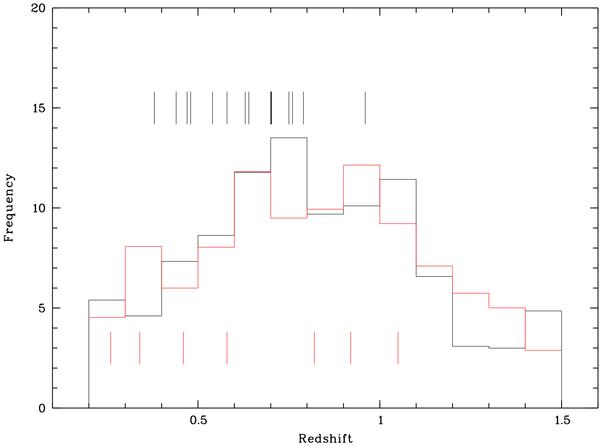
Normalized redshift distributions of our photo-zs (black histogram) superimposed on the VVDS deep and ultra deep spectroscopic redshift distribution (red histogram). Short black vertical lines show the redshift distribution of known NED clusters along our lines of sight. Short red vertical lines show the redshift distribution of known clusters in the VVDS deep survey from Mazure et al. (2007).
Current usage metrics show cumulative count of Article Views (full-text article views including HTML views, PDF and ePub downloads, according to the available data) and Abstracts Views on Vision4Press platform.
Data correspond to usage on the plateform after 2015. The current usage metrics is available 48-96 hours after online publication and is updated daily on week days.
Initial download of the metrics may take a while.