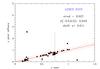
Fig. 11
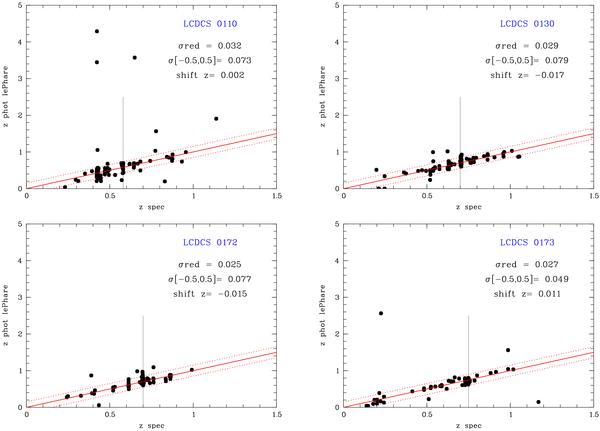
Spectroscopic versus photometric redshifts for 4 clusters. We also give the dispersions around the mean relation (reduced value, classical value excluding galaxies for which the difference between spectroscopic and photometric redshifts is greater than 0.5), and the mean shift between photo-zs and speczs. The solid inclined lines give the perfect relation while the dotted lines give the ±0.15 relations. The vertical lines give the position of the cluster along the line of sight.
Current usage metrics show cumulative count of Article Views (full-text article views including HTML views, PDF and ePub downloads, according to the available data) and Abstracts Views on Vision4Press platform.
Data correspond to usage on the plateform after 2015. The current usage metrics is available 48-96 hours after online publication and is updated daily on week days.
Initial download of the metrics may take a while.