Free Access
Fig. 9
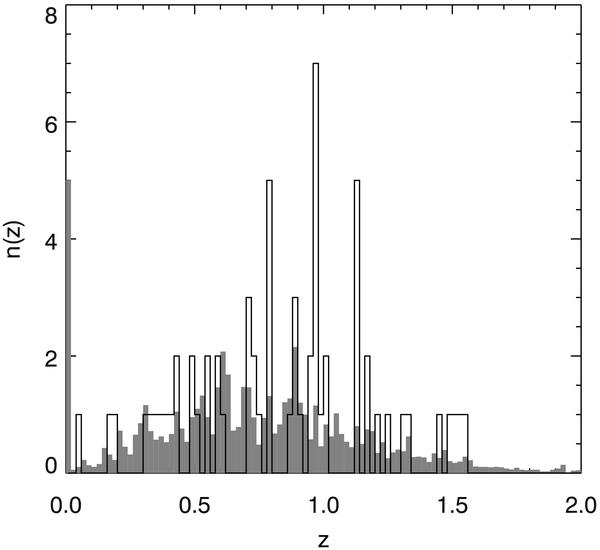
Spectroscopic redshift distribution within 1.2′ of the centre of the X-ray emission for candidate JKCS 041 (solid black line histogram). The redshift distribution of the entire sample is shown by the filled grey histogram.
Current usage metrics show cumulative count of Article Views (full-text article views including HTML views, PDF and ePub downloads, according to the available data) and Abstracts Views on Vision4Press platform.
Data correspond to usage on the plateform after 2015. The current usage metrics is available 48-96 hours after online publication and is updated daily on week days.
Initial download of the metrics may take a while.