Fig. 4
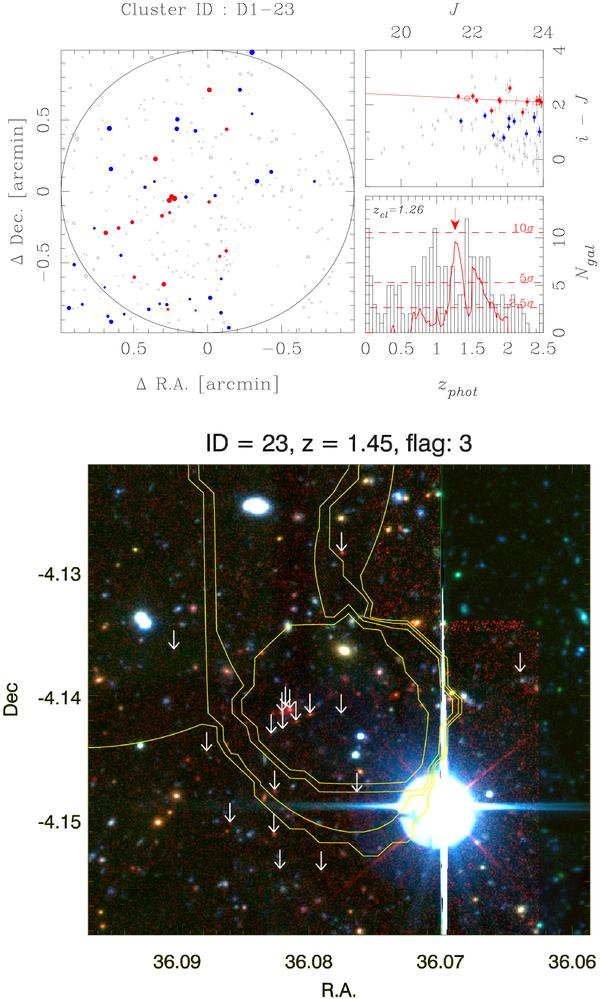
Top: spatial distribution, colour-magnitude plot and redshift distribution/significance from the red sequence analysis. The red points in the spatial distribution and colour − magnitude plot show the photometrically identified red-sequence galaxies. Blue points show galaxies not selected as being part of the red-sequence at the estimated cluster redshift and grey points show galaxies within the cluster radius at other redshifts. The third panel shows the redshift distribution of galaxies within the cluster radius (divided by the overall field redshift distribution – field black histogram), whilst the significance of the red-sequence detections as a function of redshift is given by the solid red line. The dashed horizontal lines give the significance scale. Bottom: colour image combining CFHTLS g, i and WIRDS Ks band imaging of cluster candidate WIRDXC J0224.3-0408. The yellow contours show the X-ray emission. White arrows denote galaxies selected via the red-sequence analysis. The area covered by the image is 2.3′ × 2.3′.
Current usage metrics show cumulative count of Article Views (full-text article views including HTML views, PDF and ePub downloads, according to the available data) and Abstracts Views on Vision4Press platform.
Data correspond to usage on the plateform after 2015. The current usage metrics is available 48-96 hours after online publication and is updated daily on week days.
Initial download of the metrics may take a while.