Fig. 22
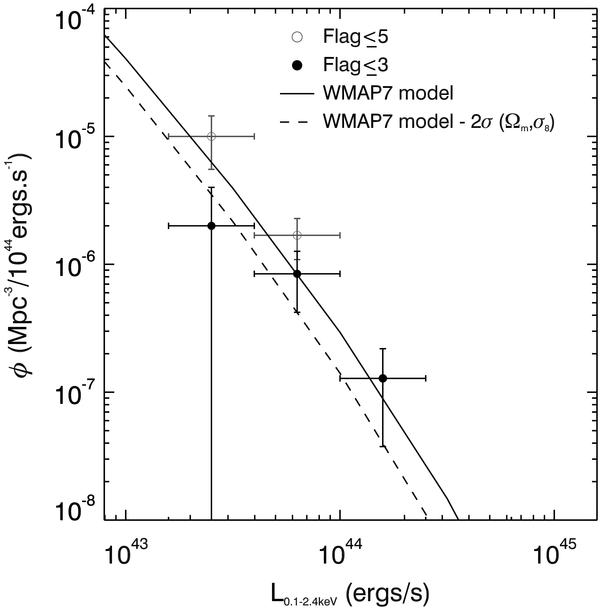
X-ray luminosity function calculated for 1.1 ≤ z ≤ 2.0 candidate clusters in the CFHTLS D1 and D4 fields. The filled circles show the X-ray luminosity function for flag ≤ 3 cluster candidates only, whilst the open circles show the result for all candidates with flag ≤ 5. The solid line shows the predicted luminosity function based on our survey geometry and WMAP 7-year cosmological parameters. The dashed line shows the same but with the WMAP 7-year Ωm and σ8 parameters reduced by 2σ.
Current usage metrics show cumulative count of Article Views (full-text article views including HTML views, PDF and ePub downloads, according to the available data) and Abstracts Views on Vision4Press platform.
Data correspond to usage on the plateform after 2015. The current usage metrics is available 48-96 hours after online publication and is updated daily on week days.
Initial download of the metrics may take a while.