Fig. 20
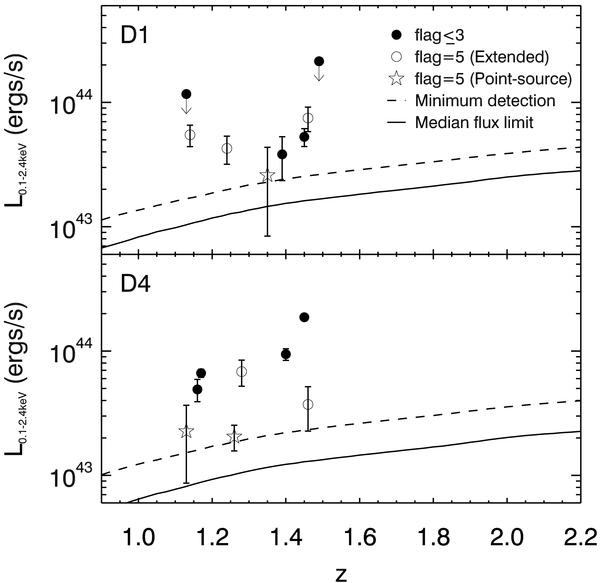
Cluster luminosity probed as a function of redshift in the D1 (top panel) and D4 (lower panel) fields. The flag = 5 (open circles) and flag ≤ 3 (filled circles) extended cluster candidates are shown. Open stars show the point-source confusion cluster candidates. The dashed line shows the X-ray luminosity limit based on the minimum extended X-ray flux detection in the data, whilst the solid line shows the X-ray luminosity limit based on the median X-ray flux limit.
Current usage metrics show cumulative count of Article Views (full-text article views including HTML views, PDF and ePub downloads, according to the available data) and Abstracts Views on Vision4Press platform.
Data correspond to usage on the plateform after 2015. The current usage metrics is available 48-96 hours after online publication and is updated daily on week days.
Initial download of the metrics may take a while.