Fig. 2
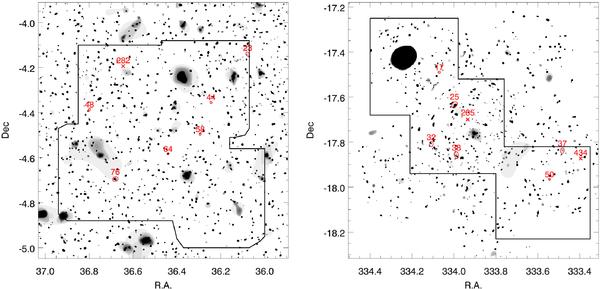
X-ray contour maps of the CFHTLS D1 (left) and D4 (right) fields. The grey-scale shows the smoothed X-ray flux. Detected extended X-ray cluster candidates are ringed and numbered, whilst point-source X-ray cluster candidates are marked by red crosses and numbered field. Both maps cover an area of 1° × 1°, the entirety of which is covered by the CFHTLS deep optical u∗griz data. The solid lines denote the extent of our near-infrared JHKs imaging data.
Current usage metrics show cumulative count of Article Views (full-text article views including HTML views, PDF and ePub downloads, according to the available data) and Abstracts Views on Vision4Press platform.
Data correspond to usage on the plateform after 2015. The current usage metrics is available 48-96 hours after online publication and is updated daily on week days.
Initial download of the metrics may take a while.