Fig. 1
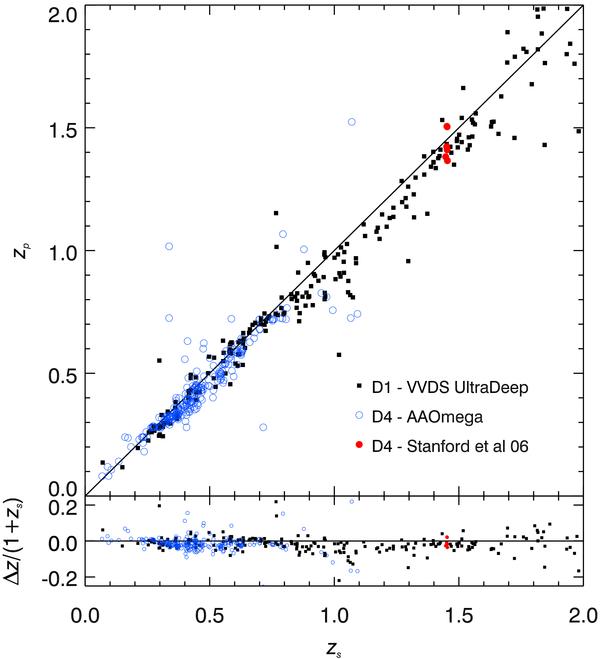
Comparison of the spectroscopic and photometric redshifts in the CFHTLS D1 and D4 fields. All photometric redshifts are taken form our 8-band WIRDS photometric redshift catalogues. Spectroscopic redshifts are from the VVDS ultra-deep (23 < i < 24.75) sample for the D1 data (black squares) and the AAOmega spectra described in Sect. 2.2 (open blue circles) and 5 spectroscopic redshifts from Stanford et al. (2006) (filled red circles) for the D4 data.
Current usage metrics show cumulative count of Article Views (full-text article views including HTML views, PDF and ePub downloads, according to the available data) and Abstracts Views on Vision4Press platform.
Data correspond to usage on the plateform after 2015. The current usage metrics is available 48-96 hours after online publication and is updated daily on week days.
Initial download of the metrics may take a while.