Fig. 7
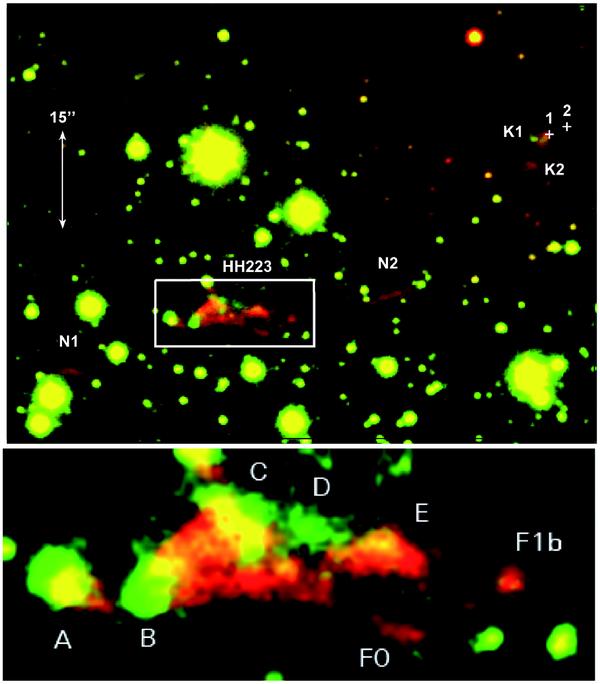
Top panel: Composite image, using a
H2 2.122 μm (red) and
[Fe ii] 1.644 μm (green) colour coding, of a FOV
 of L723 showing
part of the HH 223 outflow (continua were not subtracted). Crosses mark the
position of the radio continuum sources SMA1 and SMA2, close to the H2
structure K1 (see also Fig. 8).
Bottom panel: Close-up of the
of L723 showing
part of the HH 223 outflow (continua were not subtracted). Crosses mark the
position of the radio continuum sources SMA1 and SMA2, close to the H2
structure K1 (see also Fig. 8).
Bottom panel: Close-up of the  rectangle
enclosing HH 223. Note the spatial displacements between the [Fe ii] and
H2 emissions in the knots. North is up and East is to the left.
rectangle
enclosing HH 223. Note the spatial displacements between the [Fe ii] and
H2 emissions in the knots. North is up and East is to the left.

Current usage metrics show cumulative count of Article Views (full-text article views including HTML views, PDF and ePub downloads, according to the available data) and Abstracts Views on Vision4Press platform.
Data correspond to usage on the plateform after 2015. The current usage metrics is available 48-96 hours after online publication and is updated daily on week days.
Initial download of the metrics may take a while.