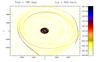
Fig. 6
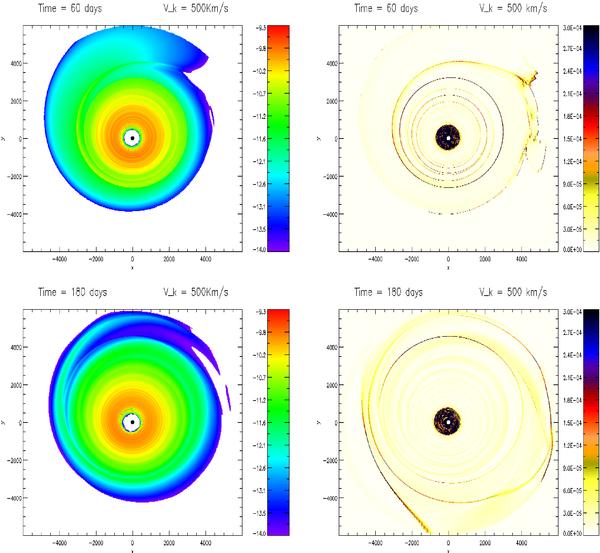
Left column: rest-mass density after 60 and 180d for a recoil velocity Vk = 500 km s-1 applied to model L.00. The scale is logarithmic and expressed in cgs units. Right column: shock structure as presented in Fig. 1 for the same panels in the left column. Once again we remark that is very hard to locate a shock by simply looking at the density distribution, especially when they are very weak (here we have used χ = 0 in Eq. (30)). Note also that the temperature distribution is inversionally proportional to that of the density (not shown here).
Current usage metrics show cumulative count of Article Views (full-text article views including HTML views, PDF and ePub downloads, according to the available data) and Abstracts Views on Vision4Press platform.
Data correspond to usage on the plateform after 2015. The current usage metrics is available 48-96 hours after online publication and is updated daily on week days.
Initial download of the metrics may take a while.