Fig. 11
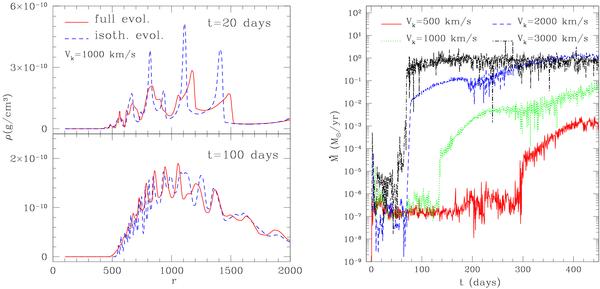
Left panel: comparison of the rest-mass density along the φ = 0 direction as obtained with the standard evolution of the energy equation (red solid line) and with the isothermal evolution (blue dashed line), at two different times as shown in the two panels. The data refers to model L.00 with a recoil of 1000 km s-1. Right panel: mass accretion rate at r = rmin for the isothermal evolution and different values of the kick velocity in the large-size model L.00. This panel should be compared with Fig. 9 and which refers to an evolution of the energy equation.
Current usage metrics show cumulative count of Article Views (full-text article views including HTML views, PDF and ePub downloads, according to the available data) and Abstracts Views on Vision4Press platform.
Data correspond to usage on the plateform after 2015. The current usage metrics is available 48-96 hours after online publication and is updated daily on week days.
Initial download of the metrics may take a while.