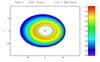
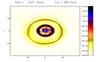
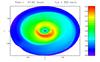
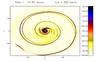
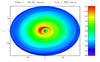
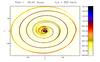
Fig. 1

Rest-mass density distributions (left columns) and shock structure (right columns) and at three different times (i.e. t = 6.07,47.90 and 99.46h) for model S.00 and a recoiling velocity Vk = 300 km s-1. Note that the last panel refers to almost 25 orbital revolutions. The rest-mass density is plotted on logarithmic scale and in cgs units, while the shock structure is obtained by plotting the quantity Sd (see beginning of Sect. 5.1.1 for a definition); shock waves can form in regions where Sd > 0. Note that is very hard to locate a shock by simply looking at the density distribution.
Current usage metrics show cumulative count of Article Views (full-text article views including HTML views, PDF and ePub downloads, according to the available data) and Abstracts Views on Vision4Press platform.
Data correspond to usage on the plateform after 2015. The current usage metrics is available 48-96 hours after online publication and is updated daily on week days.
Initial download of the metrics may take a while.