Fig. 2
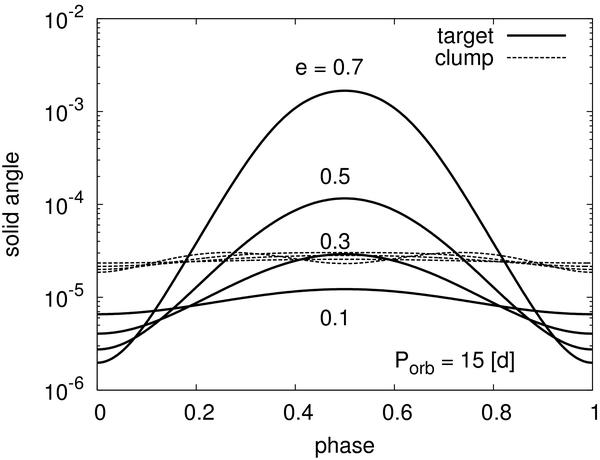
The solid curves denote the accretion radii for different eccentricities (e = 0.1,0.3,0.5,0.7). Dashed curves show the variations of the clump sizes in the same systems. Phase 0 corresponds to apastron passages. The orbital period is fixed as Porb = 15 d. With this Porb, the clump size is larger than that of the accretion radius when the eccentricity is low. Hence, flares rarely occur for these low e cases. On the other hand, when e is higher, the size of accretion radius becomes larger than clump size and the outburst may occur. This size-relation is reflected in Fig. 1.
Current usage metrics show cumulative count of Article Views (full-text article views including HTML views, PDF and ePub downloads, according to the available data) and Abstracts Views on Vision4Press platform.
Data correspond to usage on the plateform after 2015. The current usage metrics is available 48-96 hours after online publication and is updated daily on week days.
Initial download of the metrics may take a while.