Fig. B.5
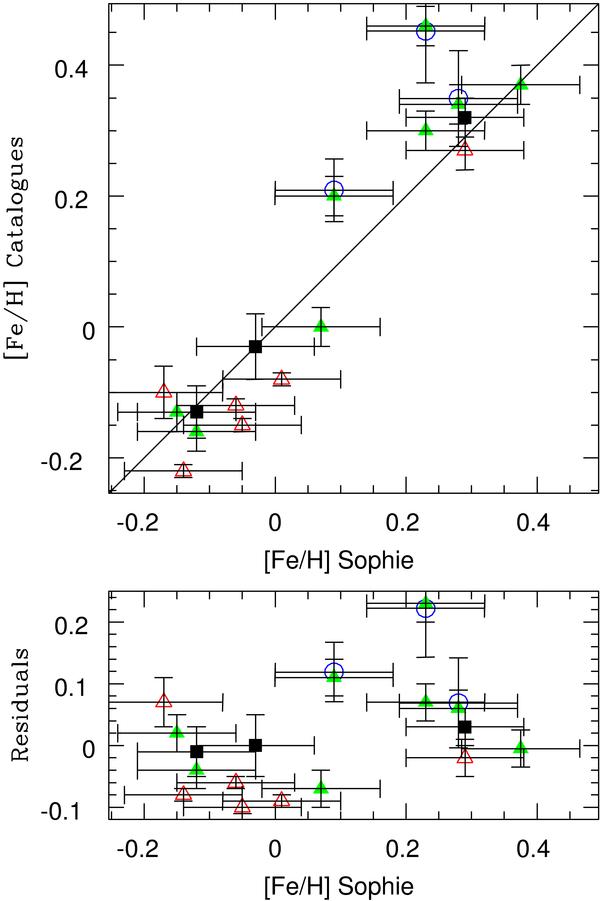
Top: [Fe/H] from others estimations from spectroscopic analyses: Sousa et al. (2006) (black squares), Sousa et al. (2008) (red open triangles), Gonzalez et al. (2007) (blue circle), and Fischer & Valenti (2005) (filled green triangles) as function of those from SOPHIE calibration. The solid line illustrates a 1:1 correlation. Bottom: residuals from the top panel as a function of [Fe/H] from SOPHIE calibration. The rms of the residuals is 0.09 dex.
Current usage metrics show cumulative count of Article Views (full-text article views including HTML views, PDF and ePub downloads, according to the available data) and Abstracts Views on Vision4Press platform.
Data correspond to usage on the plateform after 2015. The current usage metrics is available 48-96 hours after online publication and is updated daily on week days.
Initial download of the metrics may take a while.