Fig. 3
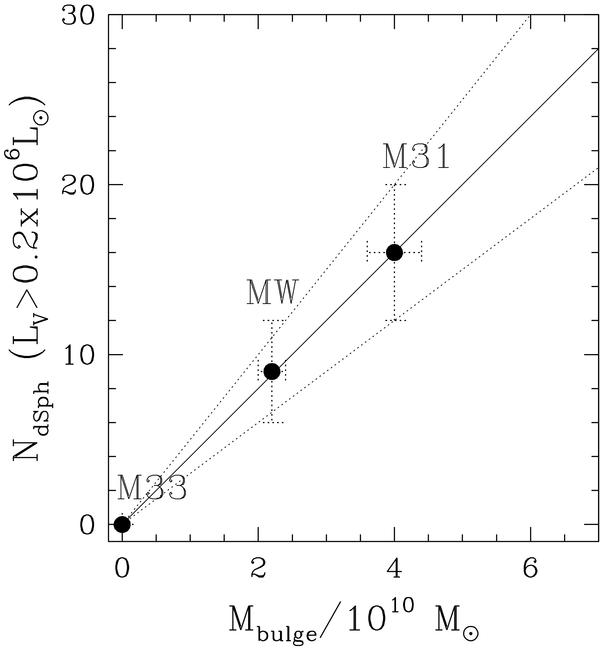
The number of dSph and dE satellite galaxies more luminous than 0.2 × 10⁶L⊙ is plotted versus the bulge mass of the host galaxy (MW: Zhao 1996, M 31: Kent 1989, M 33: Gebhardt et al. 2001). Only satellites within a distance of 270 kpc of the MW and M 31 are used. The solid line (slope = 4.03) is Eq. (17). The upper (slope = 5.03) and the lower (slope = 3.03) dotted lines illustrate the relative uncertainty assumed in the Monte Carlo experiment (see Sect. 4).
Current usage metrics show cumulative count of Article Views (full-text article views including HTML views, PDF and ePub downloads, according to the available data) and Abstracts Views on Vision4Press platform.
Data correspond to usage on the plateform after 2015. The current usage metrics is available 48-96 hours after online publication and is updated daily on week days.
Initial download of the metrics may take a while.