Fig. 9
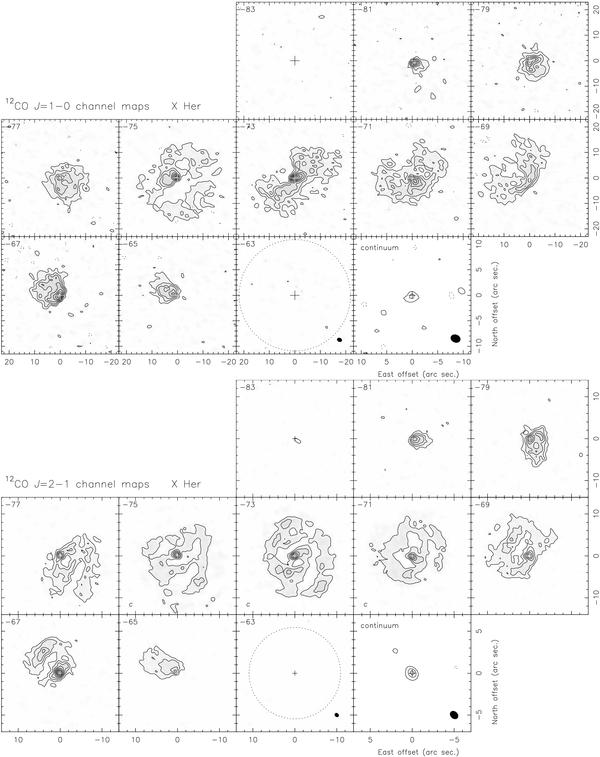
Channel maps of the 12CO J = 1−0 and
J = 2−1 line emission towards X Her, at the LSR velocities
(units of km s-1) specified in the top-left corner of each panel. No
primary beam attenuation correction is applied. (Top) CO
J = 1−0: contours are plotted from and with a spacing of
2.5σ, where σ = 10 mJy beam-1.
Equivalent negative contours are plotted in dashed lines. The last panel presents
the continuum emission from and with a spacing of 2.5σ, with
σ = 0.35 mJy beam-1. The synthesized beam is
 at PA = 68°, and is drawn in the
bottom-right corner of the two last panels. (Bottom)
CO J = 2−1: the first contour and spacing are of
4σ, except for the channels marked with c, in
the left-bottom corner, where they are 6σ, with
σ = 16 mJy beam-1. Equivalent negative contours are
plotted in dashed lines. In these maps, and mainly in the channels marked with
c, the recovering of short-spacing was very complex, and so we
remain refrain from interpreting the extended distribution in the three central
channels (see Sect. 4.1.5). The last panel
presents the continuum emission with a contour spacing of 6σ from
the first at 3σ, with
σ = 0.6 mJy beam-1. The synthesized beam is
at PA = 68°, and is drawn in the
bottom-right corner of the two last panels. (Bottom)
CO J = 2−1: the first contour and spacing are of
4σ, except for the channels marked with c, in
the left-bottom corner, where they are 6σ, with
σ = 16 mJy beam-1. Equivalent negative contours are
plotted in dashed lines. In these maps, and mainly in the channels marked with
c, the recovering of short-spacing was very complex, and so we
remain refrain from interpreting the extended distribution in the three central
channels (see Sect. 4.1.5). The last panel
presents the continuum emission with a contour spacing of 6σ from
the first at 3σ, with
σ = 0.6 mJy beam-1. The synthesized beam is
 at PA = 49°, and is drawn in the
bottom-right corner of the two last panels. The primary beams are plotted at half
power in dotted lines in the last panels of the channel maps. The central
coordinates are RA 16:02:39.140, Dec 47:14:25.55 (J2000).
at PA = 49°, and is drawn in the
bottom-right corner of the two last panels. The primary beams are plotted at half
power in dotted lines in the last panels of the channel maps. The central
coordinates are RA 16:02:39.140, Dec 47:14:25.55 (J2000).
Current usage metrics show cumulative count of Article Views (full-text article views including HTML views, PDF and ePub downloads, according to the available data) and Abstracts Views on Vision4Press platform.
Data correspond to usage on the plateform after 2015. The current usage metrics is available 48-96 hours after online publication and is updated daily on week days.
Initial download of the metrics may take a while.