Fig. 6
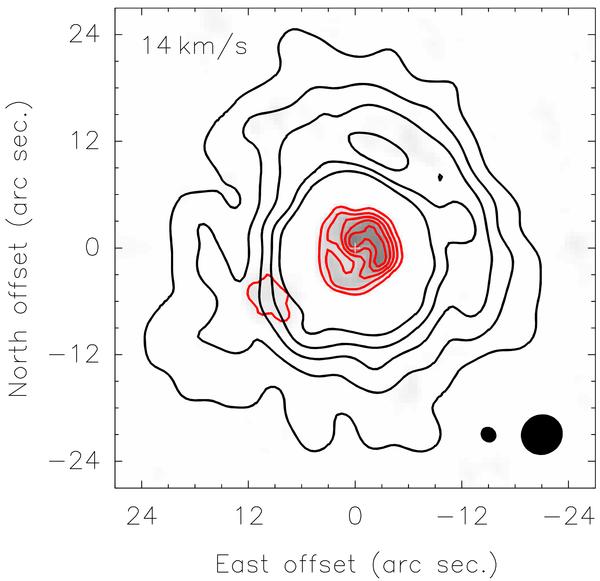
Composite image of TX Cam overlaying the 12CO J = 1−0 emission in the outermost regions (black contours) and the 12CO J = 2−1 emission from the interferometric data alone (red contours). Interferometric data alone provide a more genuine rendition of the innermost structure. The synthesized beams of both datasets are plotted in the bottom-right corner.
Current usage metrics show cumulative count of Article Views (full-text article views including HTML views, PDF and ePub downloads, according to the available data) and Abstracts Views on Vision4Press platform.
Data correspond to usage on the plateform after 2015. The current usage metrics is available 48-96 hours after online publication and is updated daily on week days.
Initial download of the metrics may take a while.