Fig. 28
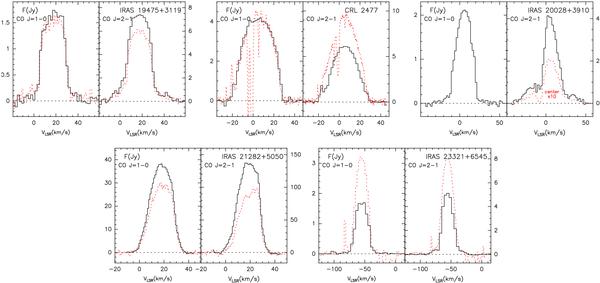
Spectra resulting from integrating the 12CO J = 1−0 and J = 2−1 emissions in interferometric maps in black solid lines, for the sources specified in the top-right corner. Red dotted lines show the profiles obtained by observing the source center with the 30 m telescope. For IRAS 21282+5050 the data shown with black solid lines correspond to merged data maps, whose fluxes are similar to those from the OTF observations. The zero level is dotted.
Current usage metrics show cumulative count of Article Views (full-text article views including HTML views, PDF and ePub downloads, according to the available data) and Abstracts Views on Vision4Press platform.
Data correspond to usage on the plateform after 2015. The current usage metrics is available 48-96 hours after online publication and is updated daily on week days.
Initial download of the metrics may take a while.