Fig. 27
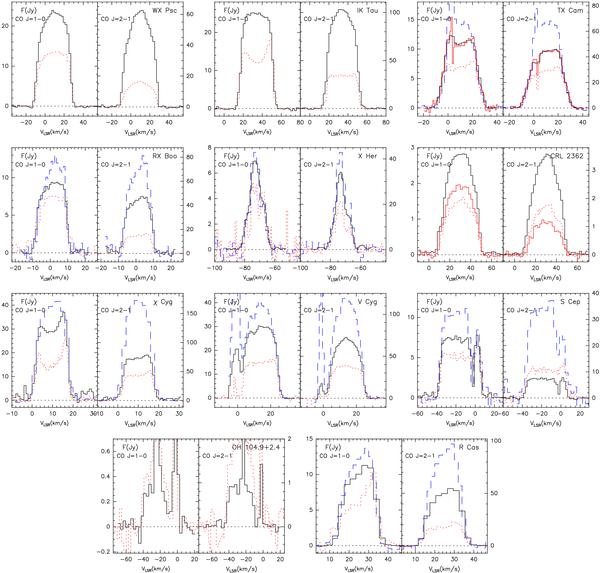
Spectra resulting from integrating the 12CO J = 1−0 and J = 2−1 emissions in merged data maps in black solid lines, for the sources specified in the top-right corner. Red dotted lines show the profiles obtained by observing the source center with the 30 m telescope. The blue dashed lines show the integrated fluxes obtained from 30 m telescope OTF observations; they are displayed when they differ from the merged data fluxes due to primary beam attenuation effects (see Sect. 3). The zero level is dotted. For TX Cam, the red and black solid lines are different in the spectral resolution, the highest-resolution spectrum showing the ISM contamination close to 0 km s-1. See Sect. 4.1.6 for details about the CRL 2362 spectra. For OH 104.9+2.4 the data shown with black solid lines were obtained with the interferometer.
Current usage metrics show cumulative count of Article Views (full-text article views including HTML views, PDF and ePub downloads, according to the available data) and Abstracts Views on Vision4Press platform.
Data correspond to usage on the plateform after 2015. The current usage metrics is available 48-96 hours after online publication and is updated daily on week days.
Initial download of the metrics may take a while.