Fig. 20
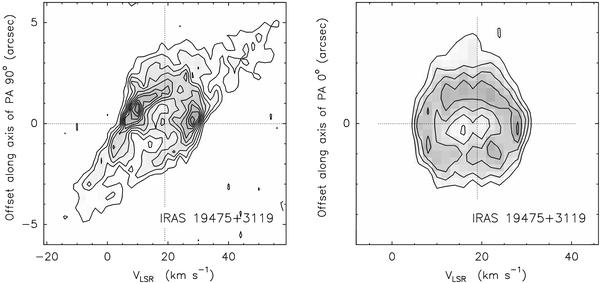
Left: position-velocity diagram along the symmetry axis at PA = 90° of the 12CO J = 2−1 emission maps towards IRAS 19475+3119. Contours are plotted from 2σ with the same spacing. Right: the same along an axis at PA = 0°. Contours are plotted from 6σ, with a spacing of 3σ (σ = 11 mJy beam-1).
Current usage metrics show cumulative count of Article Views (full-text article views including HTML views, PDF and ePub downloads, according to the available data) and Abstracts Views on Vision4Press platform.
Data correspond to usage on the plateform after 2015. The current usage metrics is available 48-96 hours after online publication and is updated daily on week days.
Initial download of the metrics may take a while.