Fig. 19
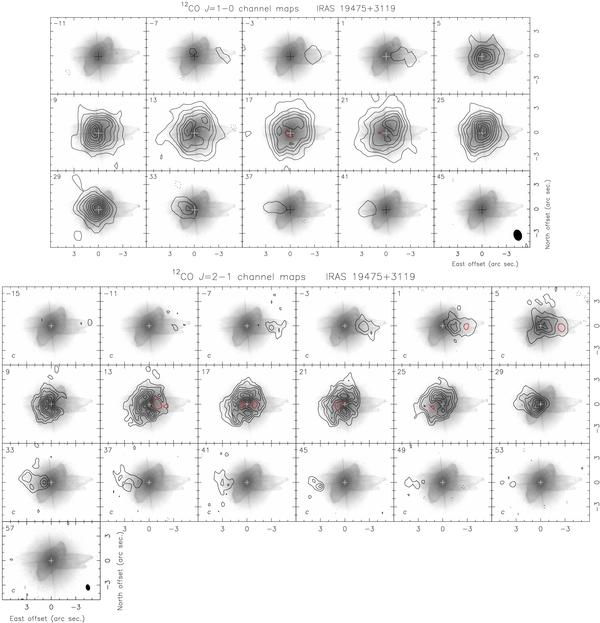
Channel maps of the 12CO J = 1−0 and
J = 2−1 emissions (in contours) toward IRAS 19475+3119 at the
LSR velocities (units of km s-1) specified in the top-left corner of
each panel. In the background, in grey scale, the optical image obtained by (Sahai et al. 2007b) is shown for comparison. No
primary beam attenuation correction is applied. (Top)
CO J = 1−0: contours are plotted from and with a spacing of
2.8σ, where σ = 6.9 mJy beam-1.
Equivalent negative contours are plotted with dashed lines. Contours presenting
relative minima in the CSE are plotted in grey (red in the electronic version).
The synthesized beam is  at PA = 17°, and is drawn in the
bottom-right corner of the last panel. No continuum emission is detected with a
σ = 0.4 mJy beam-1. (Bottom)
CO J = 2−1: contours are plotted from 6σ,
with a spacing of 3σ, where σ =
11 mJy beam-1. In the panels marked with c in the
bottom-left corner an additional contour is plotted at 3σ.
Equivalent negative contours are plotted in dashed lines. Contours presenting
relative minima in the CSE are plotted in grey (red in the electronic version).
The synthesized beam shown in the bottom-right corner of the last panel measures
0″̣8 × 0″̣5
with PA = 14°. No continuum emission is detected with a σ of
0.6 mJy beam-1. The central coordinates are RA 19:49:29.561,
Dec 31:27:16.29 (J2000).
at PA = 17°, and is drawn in the
bottom-right corner of the last panel. No continuum emission is detected with a
σ = 0.4 mJy beam-1. (Bottom)
CO J = 2−1: contours are plotted from 6σ,
with a spacing of 3σ, where σ =
11 mJy beam-1. In the panels marked with c in the
bottom-left corner an additional contour is plotted at 3σ.
Equivalent negative contours are plotted in dashed lines. Contours presenting
relative minima in the CSE are plotted in grey (red in the electronic version).
The synthesized beam shown in the bottom-right corner of the last panel measures
0″̣8 × 0″̣5
with PA = 14°. No continuum emission is detected with a σ of
0.6 mJy beam-1. The central coordinates are RA 19:49:29.561,
Dec 31:27:16.29 (J2000).
Current usage metrics show cumulative count of Article Views (full-text article views including HTML views, PDF and ePub downloads, according to the available data) and Abstracts Views on Vision4Press platform.
Data correspond to usage on the plateform after 2015. The current usage metrics is available 48-96 hours after online publication and is updated daily on week days.
Initial download of the metrics may take a while.