Fig. 18
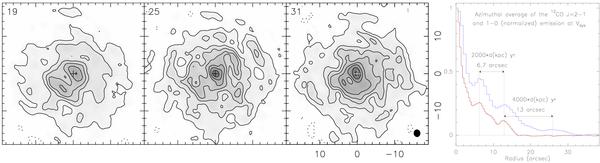
(Left:) channel maps of the 12CO J = 2−1 line emission toward R Cas equivalent to those shown in Fig. 17, resulting from CLEANing with the SDI method. Contours are plotted at 3.5, 7, 10.5, 14, 19 and 24σ and from there each 8σ, where σ = 29 mJy beam-1. Although the results obtained with different CLEANing methods allow emphasizing different structures, the resulted brightness distributions are very compatible. (Right:) the azimuthal average of the brightness distribution around the center is shown, at the systemic velocity (25 km s-1), for both 12CO J = 1−0 and J = 2−1 emission. Peaks are found at the same radius for both transitions.
Current usage metrics show cumulative count of Article Views (full-text article views including HTML views, PDF and ePub downloads, according to the available data) and Abstracts Views on Vision4Press platform.
Data correspond to usage on the plateform after 2015. The current usage metrics is available 48-96 hours after online publication and is updated daily on week days.
Initial download of the metrics may take a while.