Fig. 11
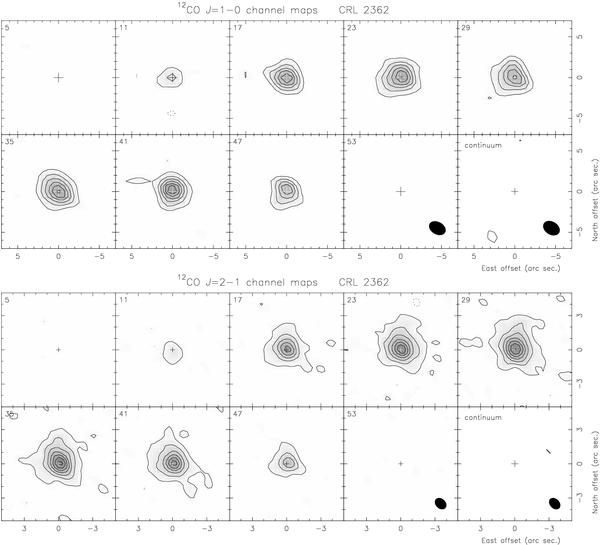
Channel maps of the 12CO J = 1−0 and
J = 2−1 emission toward CRL 2362 at the LSR velocities (units
of km s-1) specified in the top-left corner of each panel. No primary
beam attenuation correction is applied. (Top) CO
J = 1−0: contours are plotted from and with a spacing of
3σ, where σ = 7 mJy beam-1.
Negative contours are plotted in dashed lines with the same spacing. The last
panel presents the continuum emission with a first contour and contour spacing of
3σ, with σ = 0.3 mJy beam-1. The
synthesized beam is  at PA = 59°, and is drawn in the
bottom-right corner of the two last panels. (Bottom)
CO J = 2−1: contours are plotted from 3σ,
with a spacing of 5σ, where
σ = 10 mJy beam-1. Equivalent negative contours are
plotted in dashed lines. The last panel presents the continuum emission with a
first contour and contour spacing of 3σ, with
σ = 0.6 mJy beam-1. The synthesized beam is
at PA = 59°, and is drawn in the
bottom-right corner of the two last panels. (Bottom)
CO J = 2−1: contours are plotted from 3σ,
with a spacing of 5σ, where
σ = 10 mJy beam-1. Equivalent negative contours are
plotted in dashed lines. The last panel presents the continuum emission with a
first contour and contour spacing of 3σ, with
σ = 0.6 mJy beam-1. The synthesized beam is
 at PA = 47°, and is drawn in the
bottom-right corner of the two last panels. The central coordinates are
RA 19:18:14.670, Dec 23:49:27.90 (J2000).
at PA = 47°, and is drawn in the
bottom-right corner of the two last panels. The central coordinates are
RA 19:18:14.670, Dec 23:49:27.90 (J2000).
Current usage metrics show cumulative count of Article Views (full-text article views including HTML views, PDF and ePub downloads, according to the available data) and Abstracts Views on Vision4Press platform.
Data correspond to usage on the plateform after 2015. The current usage metrics is available 48-96 hours after online publication and is updated daily on week days.
Initial download of the metrics may take a while.