Fig. 1
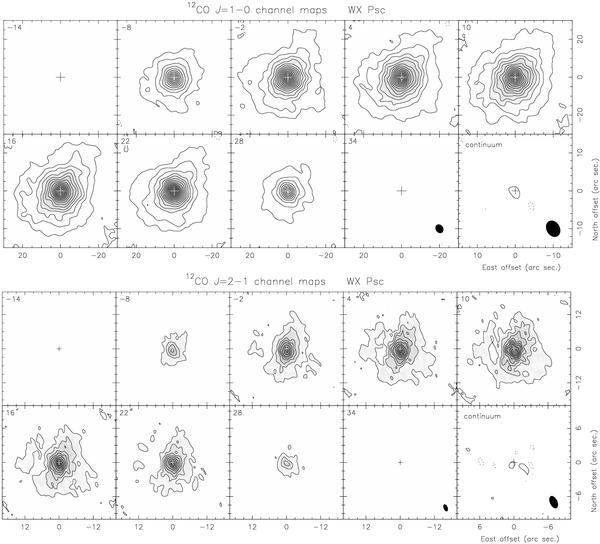
Channel maps of the 12CO J = 1−0 and
J = 2−1 line emission towards WX Psc. The maps are corrected
for primary beam attenuation. The LSR velocities (units of km s-1) are
shown in the top-left corner of each panel. (Top) CO
J = 1−0: contours start at 4σ and are in steps
of 5σ with σ = 22 mJy beam-1. Negative
contours are plotted with the same spacing in dashed lines. The last panel shows the
continuum emission with a contour spacing of 2σ and
σ = 1.6 mJy beam-1. The synthesized beam is
 at PA = 30°, and is drawn in the
bottom-right corner of the two last panels. (Bottom)
CO J = 2−1: contours start at 6σ and are in
steps of 6σ with σ = 43 mJy beam-1.
Equivalent negative contours are plotted in dashed lines. The last panel shows the
continuum emission with a contour spacing of 2σ and
σ = 6.1 mJy beam-1. The synthesized beam is
at PA = 30°, and is drawn in the
bottom-right corner of the two last panels. (Bottom)
CO J = 2−1: contours start at 6σ and are in
steps of 6σ with σ = 43 mJy beam-1.
Equivalent negative contours are plotted in dashed lines. The last panel shows the
continuum emission with a contour spacing of 2σ and
σ = 6.1 mJy beam-1. The synthesized beam is
 at PA = 22°, and is drawn in the
bottom-right corner of the two last panels. The map center coordinates are
RA 01:06:25.990, Dec +12:35:53.40 (J2000).
at PA = 22°, and is drawn in the
bottom-right corner of the two last panels. The map center coordinates are
RA 01:06:25.990, Dec +12:35:53.40 (J2000).
Current usage metrics show cumulative count of Article Views (full-text article views including HTML views, PDF and ePub downloads, according to the available data) and Abstracts Views on Vision4Press platform.
Data correspond to usage on the plateform after 2015. The current usage metrics is available 48-96 hours after online publication and is updated daily on week days.
Initial download of the metrics may take a while.