Free Access
Fig. 9
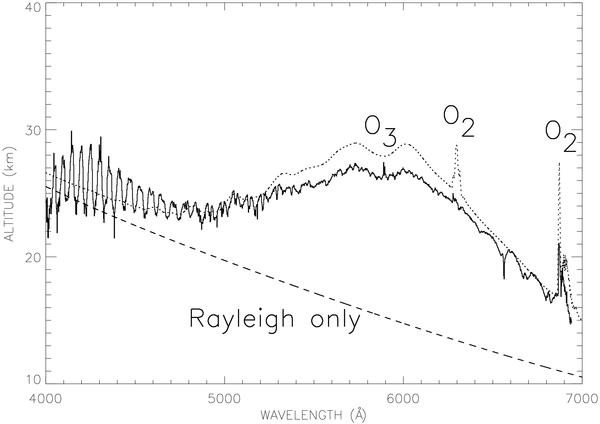
Observed binned variations (solid line) of the effective altitude h compared to model calculations (also binned). The Rayleigh-alone model calculation is shown (dashed line) along with the complete atmospheric model calculation (dotted line), which includes N2, O2 and O3 (see text).
Current usage metrics show cumulative count of Article Views (full-text article views including HTML views, PDF and ePub downloads, according to the available data) and Abstracts Views on Vision4Press platform.
Data correspond to usage on the plateform after 2015. The current usage metrics is available 48-96 hours after online publication and is updated daily on week days.
Initial download of the metrics may take a while.