Fig. 8
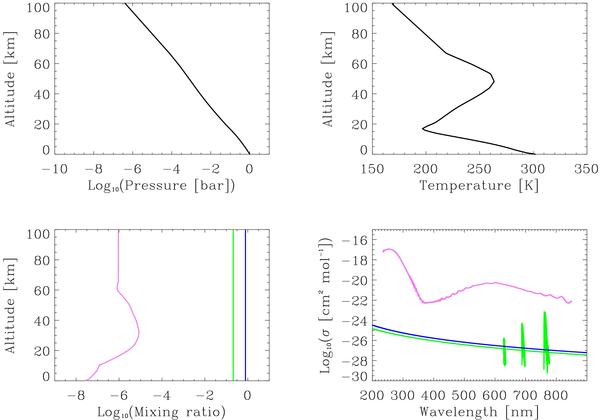
“Standard” atmosphere used in the to model calculation (see text): upper left: the pressure profile, upper right: the temperature profile, lower left, from the right to left, the N2 (blue), O2 (green) and O3 (pink) mixing ratios as a function of altitude (km), lower right, from bottom to top, the O2 (green) molecular bands and Rayleigh, N2 (blue) Rayleigh, and O3 (pink) cross sections as a function of wavelength (in nm).
Current usage metrics show cumulative count of Article Views (full-text article views including HTML views, PDF and ePub downloads, according to the available data) and Abstracts Views on Vision4Press platform.
Data correspond to usage on the plateform after 2015. The current usage metrics is available 48-96 hours after online publication and is updated daily on week days.
Initial download of the metrics may take a while.