Fig. 6
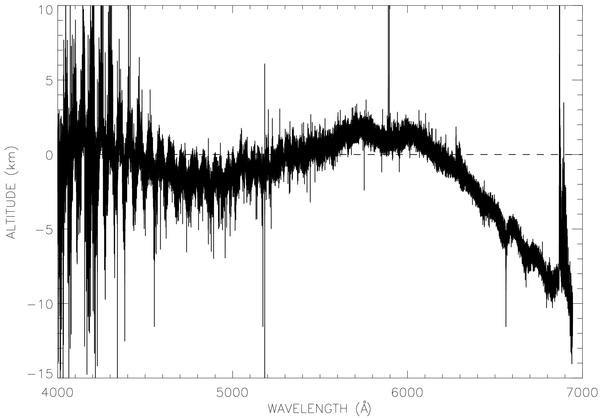
Absorbing atmosphere thickness versus wavelength, evaluated according to Eq. (14) for the 20h44 UT eclipse observation associated to the 02h56 UT full Moon ones. The reference altitude equal to 0 km (dashed line) has been chosen for λ = 4530 Å. The profile is dominated by the Chappuis band of ozone from 4800 to 6900 Å, while some signatures due to sodium and oxygen show up near 5890 Å and 6900 Å respectively. In the blue region (4000 to 4800 Å), the Rayleigh scattering is clearly seen. Across that region, the signal drops and produces more noise over the extracted altitudes, also revealing there that the SOPHIE orders are not fully corrected. This is also true longward from about 6500 Å.
Current usage metrics show cumulative count of Article Views (full-text article views including HTML views, PDF and ePub downloads, according to the available data) and Abstracts Views on Vision4Press platform.
Data correspond to usage on the plateform after 2015. The current usage metrics is available 48-96 hours after online publication and is updated daily on week days.
Initial download of the metrics may take a while.