Fig. 3
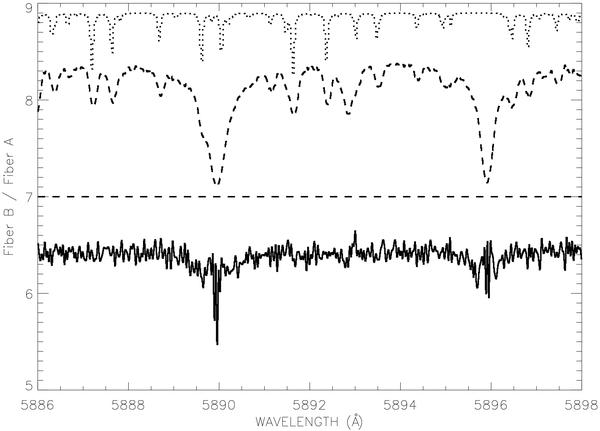
At 20h44 UT, the (Fiber B/Fiber A) ratio (solid line) is shown in the NaI doublet spectral region. The Fiber A spectrum (dashed line) with its corresponding zero level (horizontal dashed line) as extracted from the SOPHIE pipeline as well as an H2O model (dotted line) are overplotted (in arbitrary scales simply to fit within the figure frame) to show the positions of the solar as well as H2O spectral lines in the spectrum. Most of the observed lines are due to atmospheric water vapor. They disappear in the fiber’s spectral ratio, while the broad spectral wings of the two NaI solar lines are still clearly visible.
Current usage metrics show cumulative count of Article Views (full-text article views including HTML views, PDF and ePub downloads, according to the available data) and Abstracts Views on Vision4Press platform.
Data correspond to usage on the plateform after 2015. The current usage metrics is available 48-96 hours after online publication and is updated daily on week days.
Initial download of the metrics may take a while.