Fig. 2
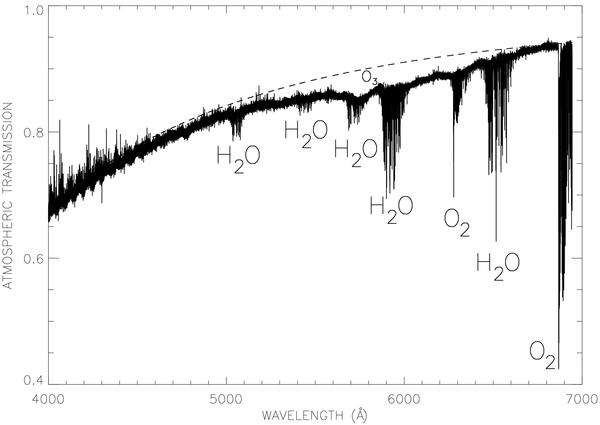
Average atmospheric transmission function T(λ) as evaluated during full Moon just after the eclipse supposed to be similar to the one during the eclipse observations. The dashed line shows a transmission model (Hayes & Latham 1975), which includes both Rayleigh diffusion and aerosols (optical depth of 0.035 at 5320 Å typical for clear OHP nights). The experimental evaluation was normalized in order to match the model at our reference wavelength λ0 = 4530 Å (see Sect. 5). O2 as well as H2O absorption bands are clearly seen. Note that the match with the model is good except for the central region from 5000 to 6700 Å, where a clear additional absorption is detected. This is the Chappuis band from ozone (noted O3), not included in the model calculation.
Current usage metrics show cumulative count of Article Views (full-text article views including HTML views, PDF and ePub downloads, according to the available data) and Abstracts Views on Vision4Press platform.
Data correspond to usage on the plateform after 2015. The current usage metrics is available 48-96 hours after online publication and is updated daily on week days.
Initial download of the metrics may take a while.