Fig. 14
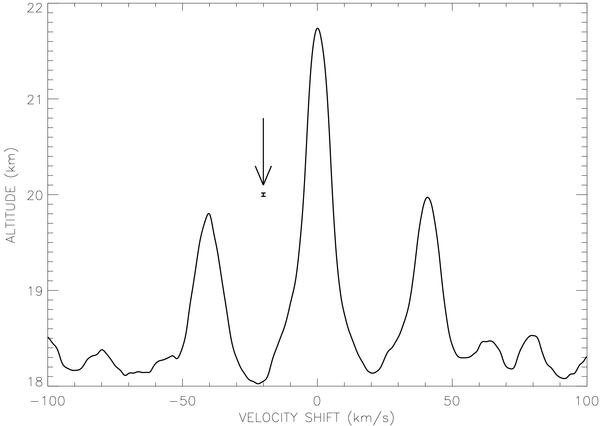
Correlation function extracted from the O2 forbidden  –
– transition band B (1–0) at 6 880 Å by using a mask centered on each of the spike positions over a ± 0.1 Å width. The typical error bar of this function is indicated (arrow) and is on the order of the tracing thickness, according to the total spectral width sampled by the mask.
Current usage metrics show cumulative count of Article Views (full-text article views including HTML views, PDF and ePub downloads, according to the available data) and Abstracts Views on Vision4Press platform.
Data correspond to usage on the plateform after 2015. The current usage metrics is available 48-96 hours after online publication and is updated daily on week days.
Initial download of the metrics may take a while.