Fig. 12
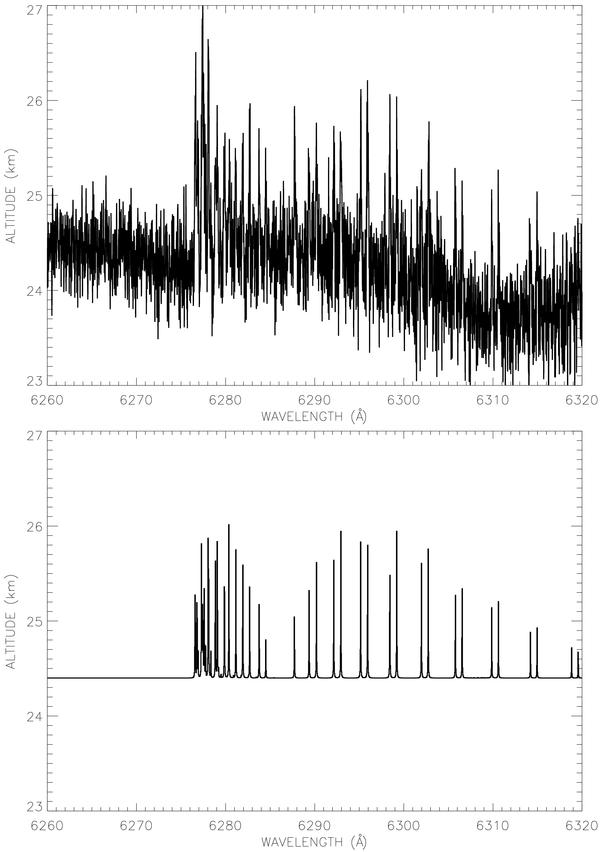
γ (2–0) 6280 Å O2 molecular band. Upper plot: same background correction as in Fig. 10 (see text). The solid line represents the altitude information as extracted from the SOPHIE data set. Lower plot: the O2 band spectral structure is shown to demonstrate the clear coincidence in position of the repeated spikes signing the O2 detection.
Current usage metrics show cumulative count of Article Views (full-text article views including HTML views, PDF and ePub downloads, according to the available data) and Abstracts Views on Vision4Press platform.
Data correspond to usage on the plateform after 2015. The current usage metrics is available 48-96 hours after online publication and is updated daily on week days.
Initial download of the metrics may take a while.