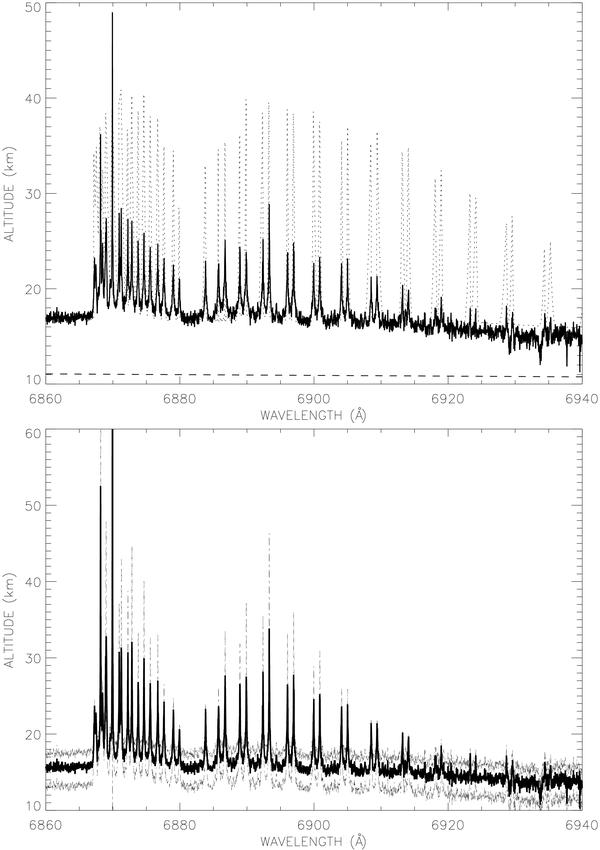
Fig. 11
O2 forbidden  –
– transition band B (1–0) at 6880 Å. The same background correction as in Fig. 10 has been applied (see text). Upper plot: the solid line represents the altitude information extracted from the SOPHIE data, while the dotted line is the model calculation, in which O2 absorption is included from 6856 Å upwards. The narrow atmospheric signatures due to the O2 absorption are clearly seen. The sharp peaks perfectly match the model with respect to spectral positions, while their heights could be quite different. Lower plot: the thick solid line again represents the evaluated altitude for the 0.0003 zero level correction, while the thin dash-dotted lines show the extreme possible variations of the estimated levels due to the 0.0002 (lower evaluations in the peaks and higher ones in the continuum) and 0.0004 (higher evaluations in the peaks and lower ones in the continuum) zero level corrections.
Current usage metrics show cumulative count of Article Views (full-text article views including HTML views, PDF and ePub downloads, according to the available data) and Abstracts Views on Vision4Press platform.
Data correspond to usage on the plateform after 2015. The current usage metrics is available 48-96 hours after online publication and is updated daily on week days.
Initial download of the metrics may take a while.